
PhotoStructure log files
PhotoStructure writes log files to a platform-specific directory. On recent versions, the exact path is shown on the About page.
Log messages can include:
- Names of files and directories being synchronized
- File metadata extracted during synchronization
- System metadata (OS, version, hardware)
Log messages never include actual image content. See error reports for details on what PhotoStructure sends automatically to our error tracking system.
🖥️ The Logs page
PhotoStructure’s built-in Logs page lets you browse, search, and download log files directly from the web UI. No need to SSH into your server or hunt through files on disk.
Errors & Warnings
The top of the Logs page shows recent log entries at warning level or above. You can filter by level (FATAL / ERROR / WARN), time range (1 H through 7 D), and free-text search. Tap any entry to see surrounding context and metadata.
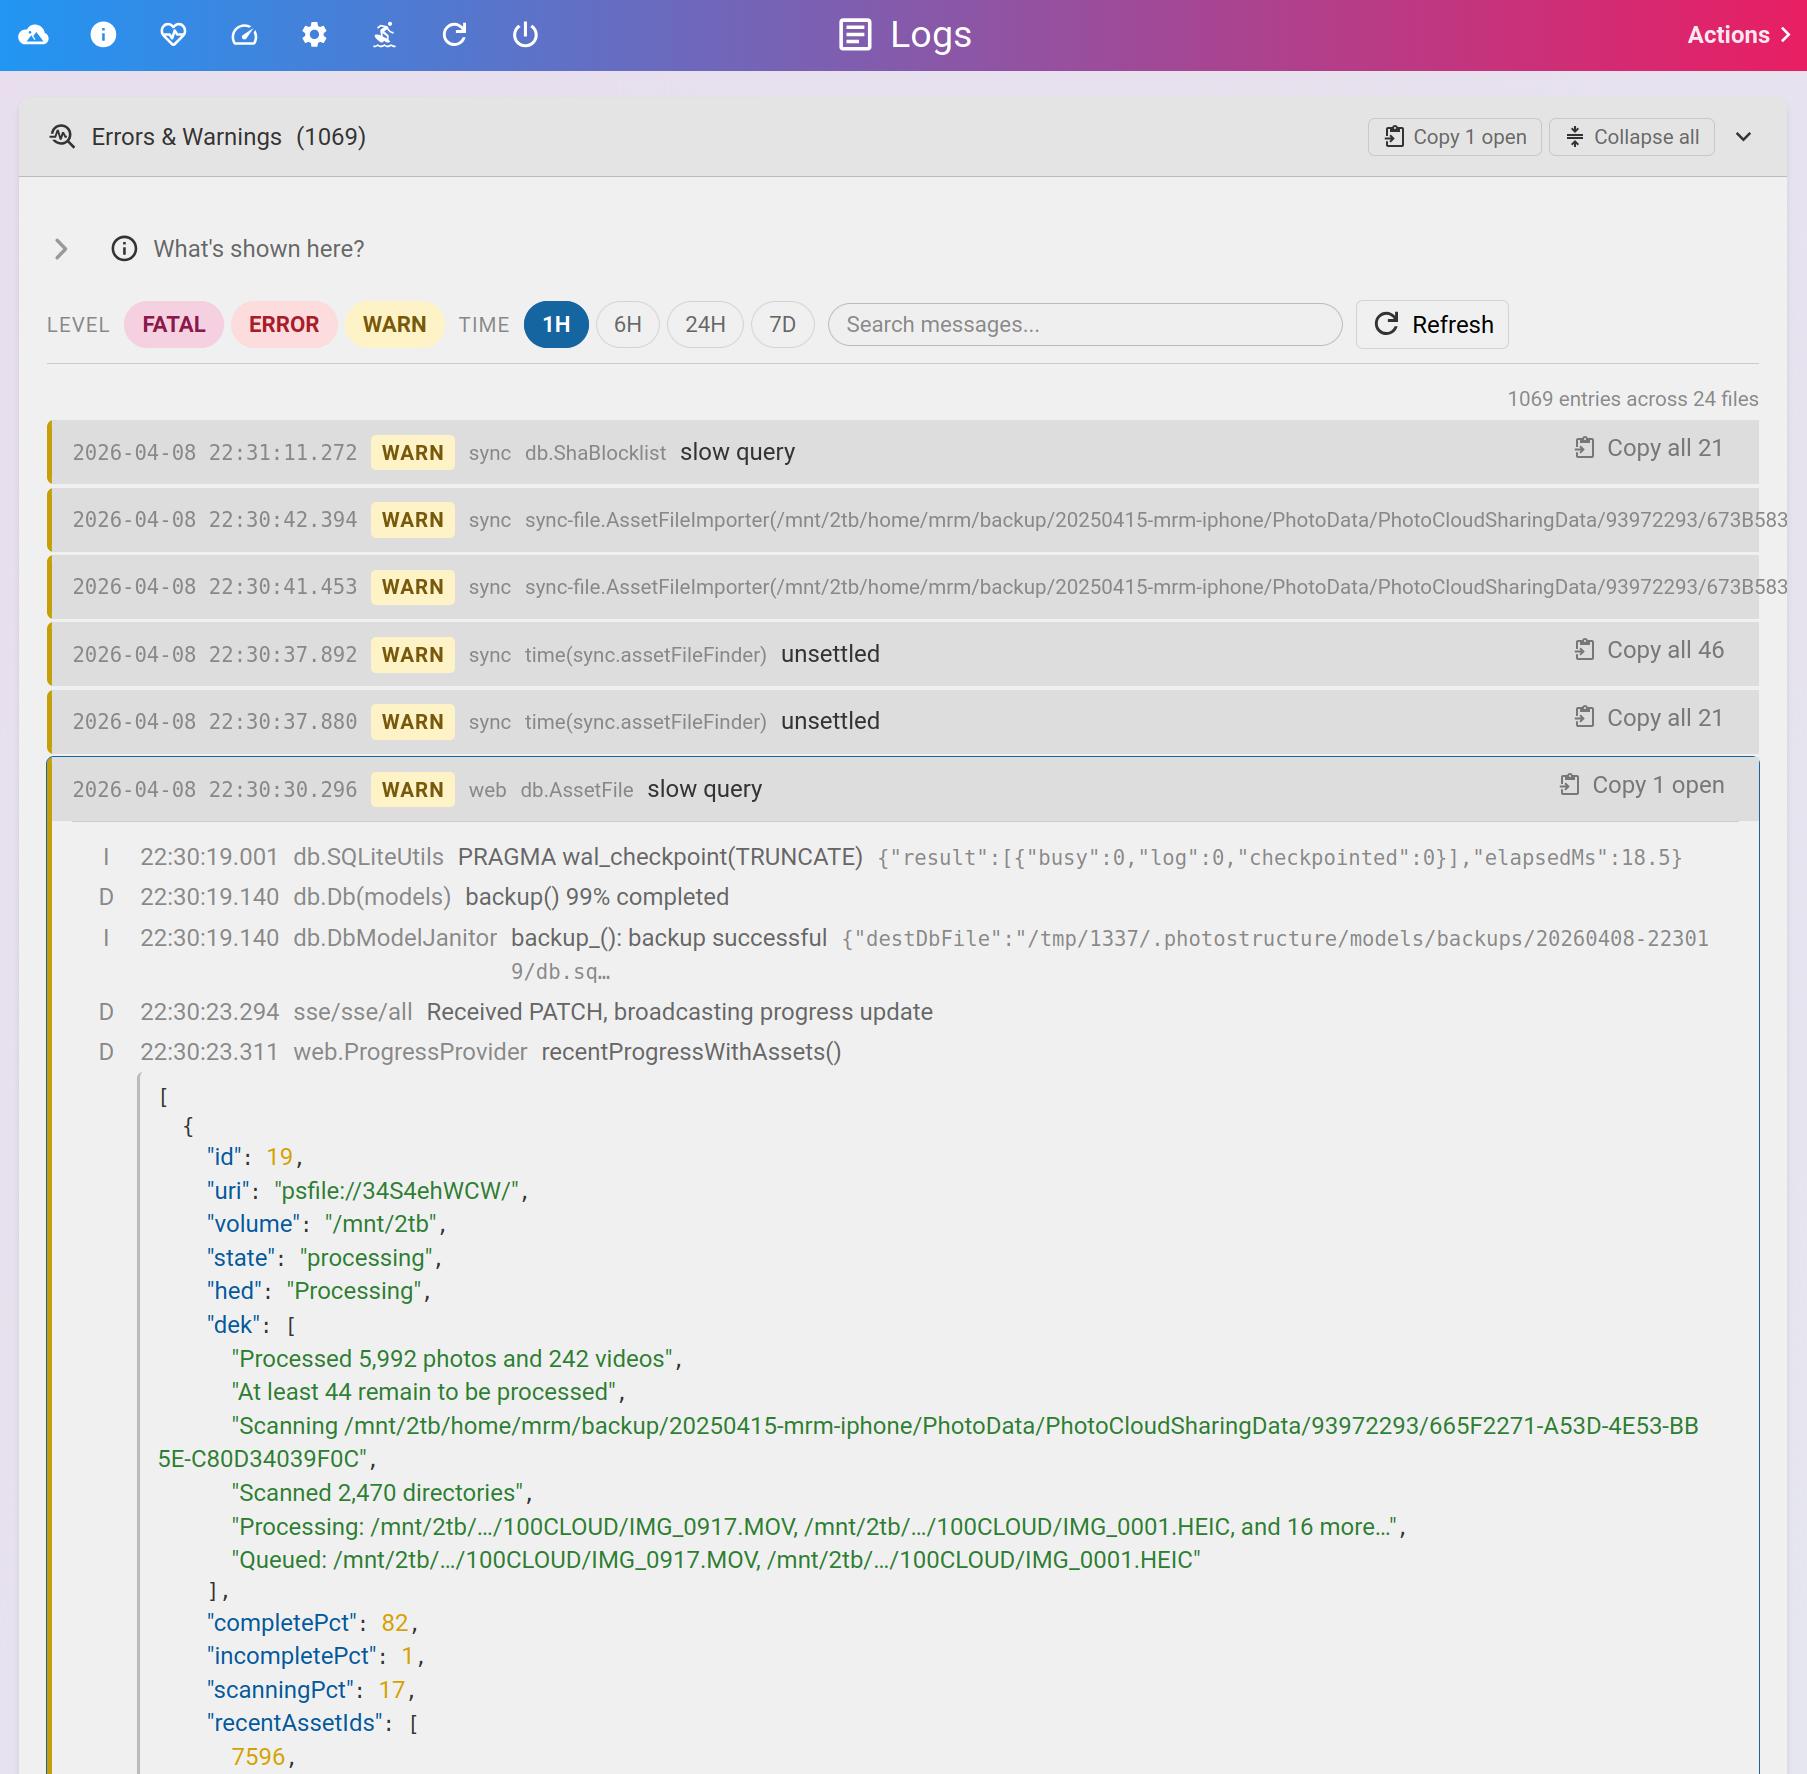
The Errors & Warnings viewer with level and time-range filters
Log Files
Below the warnings viewer, the Log Files section lists every log file for the current day. Filter by process type (MAIN, WEB, SYNC, WORKER, FATAL) and download individual files directly.
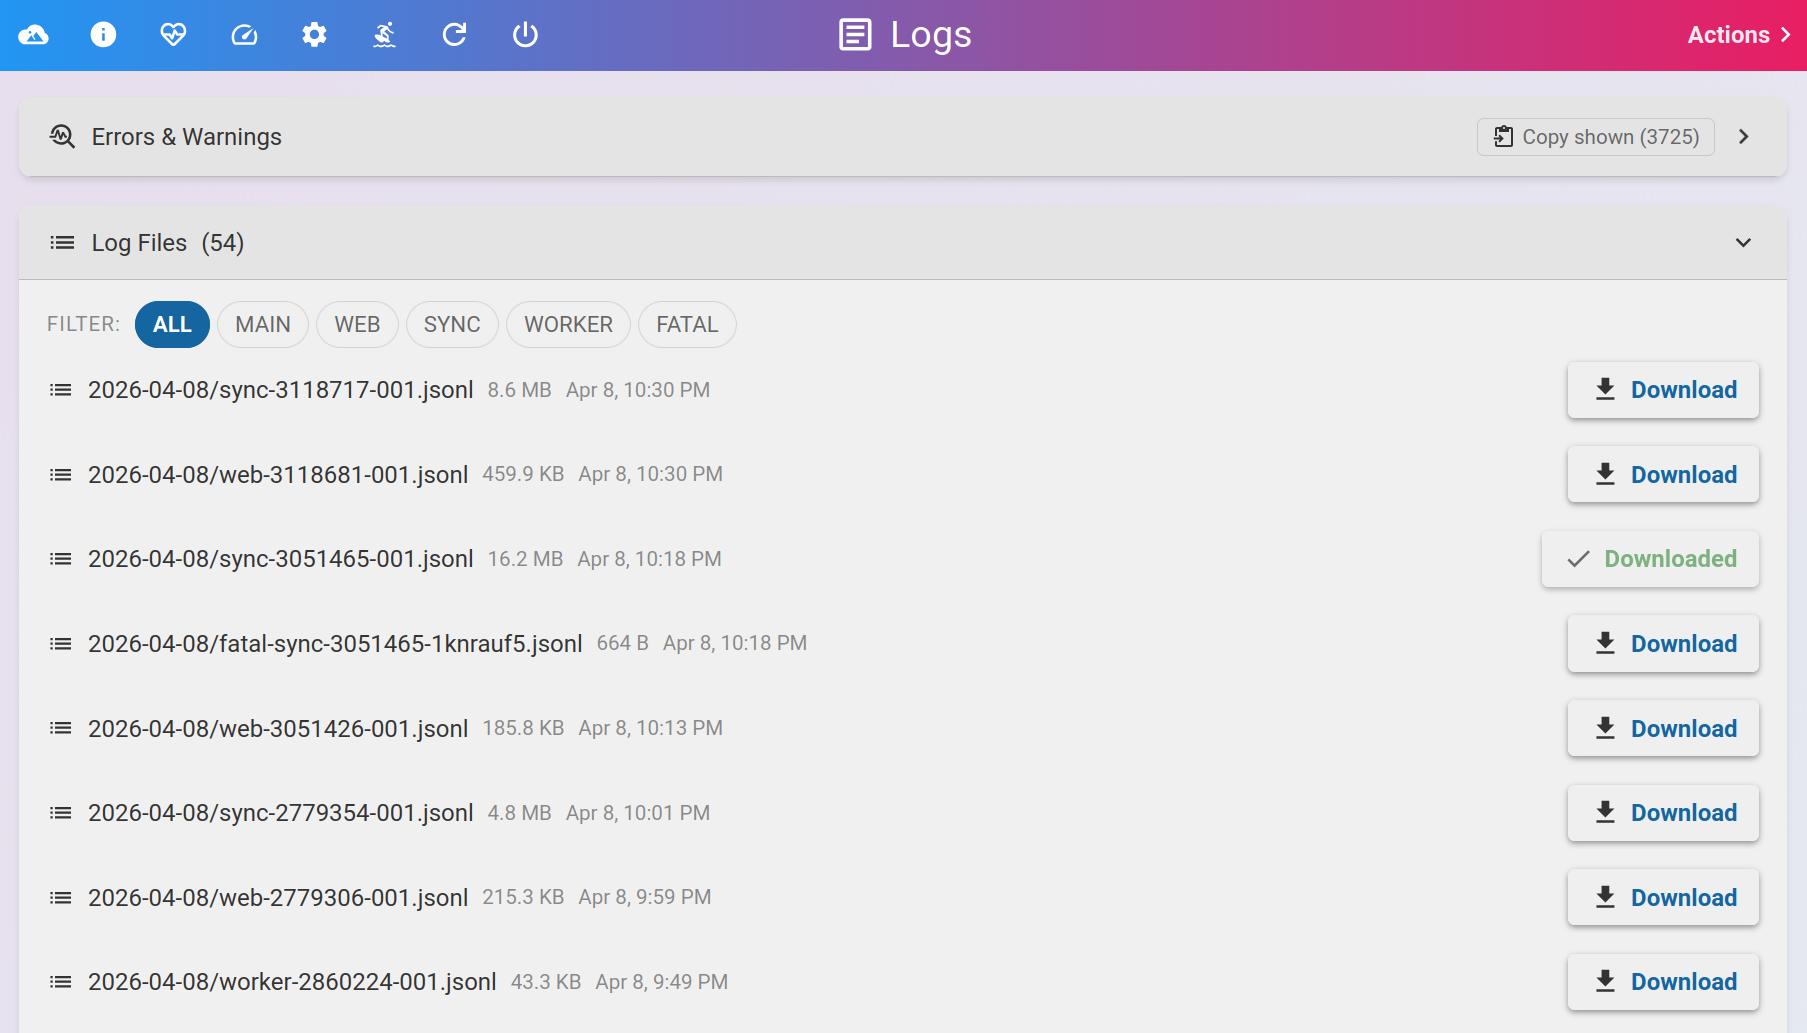
Log files with type filters and per-file download
Diagnostic downloads
The Actions menu (top-right) offers two targeted download tools:
Temporal Diagnostics bundles all logs and sync reports within a time window (± 1 minute to ± 1 hour) around a specific timestamp. Use this when you know when something went wrong.
File Diagnostics searches logs and sync reports for entries mentioning a specific file or path. Use this when you know which file is misbehaving.
Both produce a downloadable ZIP you can attach to a support email or forum post.
📊 Log levels
| Level | When to use |
|---|---|
error | Default. Only egregious problems. |
warn | Minor and expected errors. |
info | Verbose high-level execution paths. Impacts performance. |
debug | Extremely verbose. Significantly impacts performance. |
✈️ Flight recorder
PhotoStructure’s logging system includes a flight recorder that continuously buffers recent log entries, even those below your configured log level. When an error occurs, these buffered entries are automatically flushed to the log file, so you get debugging context about what happened leading up to the error without having to raise the log level in advance.
The flight recorder is enabled by default. You can tune it with these settings:
| Setting | Description |
|---|---|
logFlightRecorderCapacity | Number of entries to buffer |
logFlightRecorderMinLevel | Minimum level to capture into the buffer |
logFlightRecorderTriggerLevel | Level that triggers a buffer flush |
⚙️ Changing your log level
Most of the time the flight recorder captures enough context on its own. If
you’ve been asked to raise the log level, use the PS_LOG_LEVEL
environment variable or set logLevel directly
in your library settings.
Reset logLevel back to the default (error) when you’re done. Logging at
info or debug uses extra disk space and slows PhotoStructure down.
📤 How to send your logs
If you’ve been asked to send in logs: thank you. Sorry PhotoStructure is giving you trouble.
- Reproduce the problem (raise the log level first only if asked to)
- Open the Logs page and use Temporal Diagnostics or File Diagnostics from the Actions menu to download a ZIP of the relevant logs
- Send the ZIP via email, Dropbox, OneDrive, Google Drive, or iCloud
Log directory (manual access)
If you can’t reach the web UI, the default log directory is:
$HOME/Library/Logs/PhotoStructureon macOS%APPDATA%\PhotoStructure\logson Windows$HOME/.cache/photostructure/logson Linux/ps/library/.photostructure/logson Docker
macOS note: Finder hides the Library folder by default. Open Terminal and
run open "$HOME/Library/Logs/PhotoStructure" to open it in Finder.
Windows note: File Explorer hides %APPDATA% by default. Open a command
prompt and run start "%APPDATA%\PhotoStructure\logs" to open it in Explorer.
